29 Aug 2022
Further information: View the Fund factsheets
Invesco UK Smaller Companies Equity Fund (UK)
Invesco Perpetual UK Smaller Companies Investment Trust plc
What we know already
In a series of recent articles from the UK desk, we have highlighted the valuation opportunity in UK equities. Our analysis has looked at global markets over a period of 20 years, comparing Price/Book against Return on Equity.
The approach implicitly recognises that higher returns reinvested for higher growth merit a higher market valuation. And that, as returns change over time, so should the price of equities. It is a simple yet effective approach that has resonated with many readers.
We have long regarded the UK market as cheap, but this analysis shows that the catalyst for its outperformance since the beginning of the year has been earnings momentum.
The analysis has also shown that, faced by the increasingly likely prospect of a global recession, UK market valuations are already pricing in greater cuts to earnings than any of their global peers.
Homing in on the UK
Our analysis so far has focused on comparing the UK market to its global peers. Today, we home in on the different areas of the UK market, extending our analysis to look at valuations and returns across size categories: the FTSE All-Share, 100, 250 and Small Cap indices.
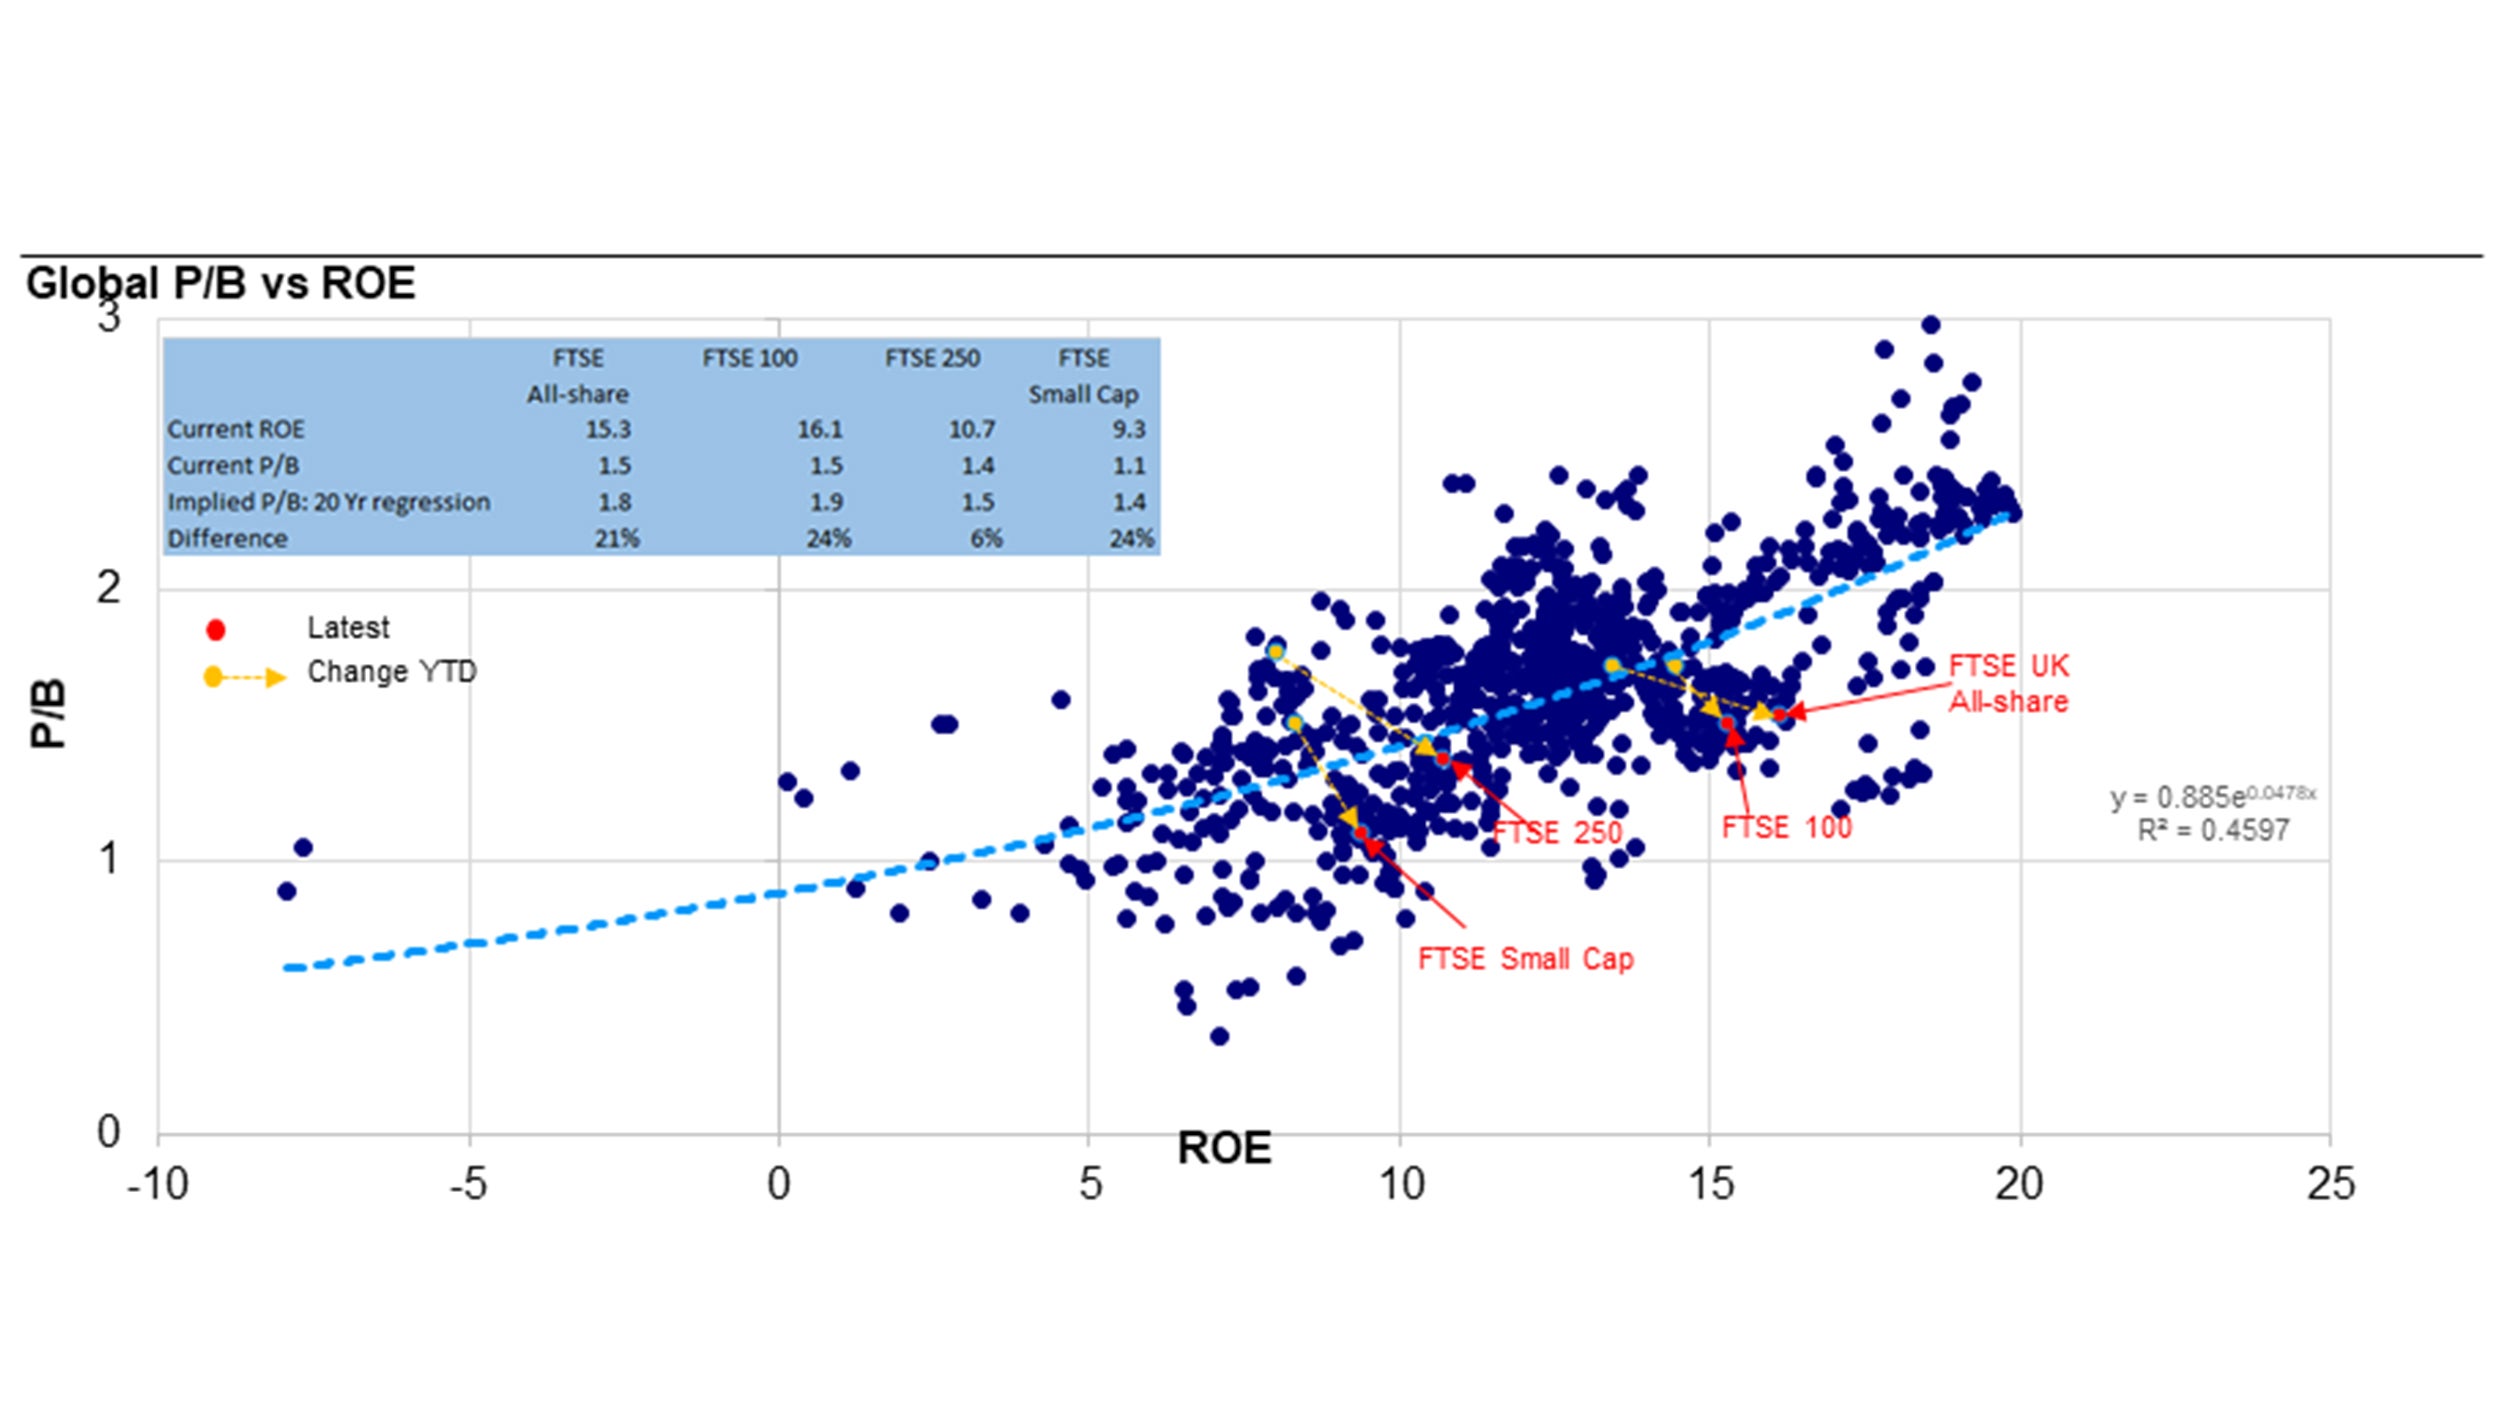
The chart below plots the monthly P/B against ROE over 20 years within the UK (some 960 observations). We have also highlighted (through use of a yellow arrow) the change from the start of the year through to the end of July.
Figure 1. Within the UK, small caps now appear to offer the best valuation. Earnings momentum since the start of the year has been weakest in the FTSE 100 and strongest in the FTSE 250

Source: Invesco, Factset as at 31 July 2022. Indices used: FTSE UK All-share, FTSE UK 100, FTSE 250, FTSE Small Cap. Plots show monthly Price to Book (P/B) ratio against monthly mean rolling 12month estimated Return on Equity (ROE), beginning 31 July 2002. The Implied P/B is the value derived from application of the algebraic equation of the trend line, substituting Current ROE for “x”.
There are a number of points to draw out from the analysis:
In short: positive returns momentum in the UK is broad based.
But what about the recession?
However, market consensus is that the UK and global economies are either already in or about to go into a recession. We would agree that equity markets in general are anticipatory, and that consensus earnings estimates are often a lagging indicator. So the question is: what cuts to earnings estimates are currently being priced in?
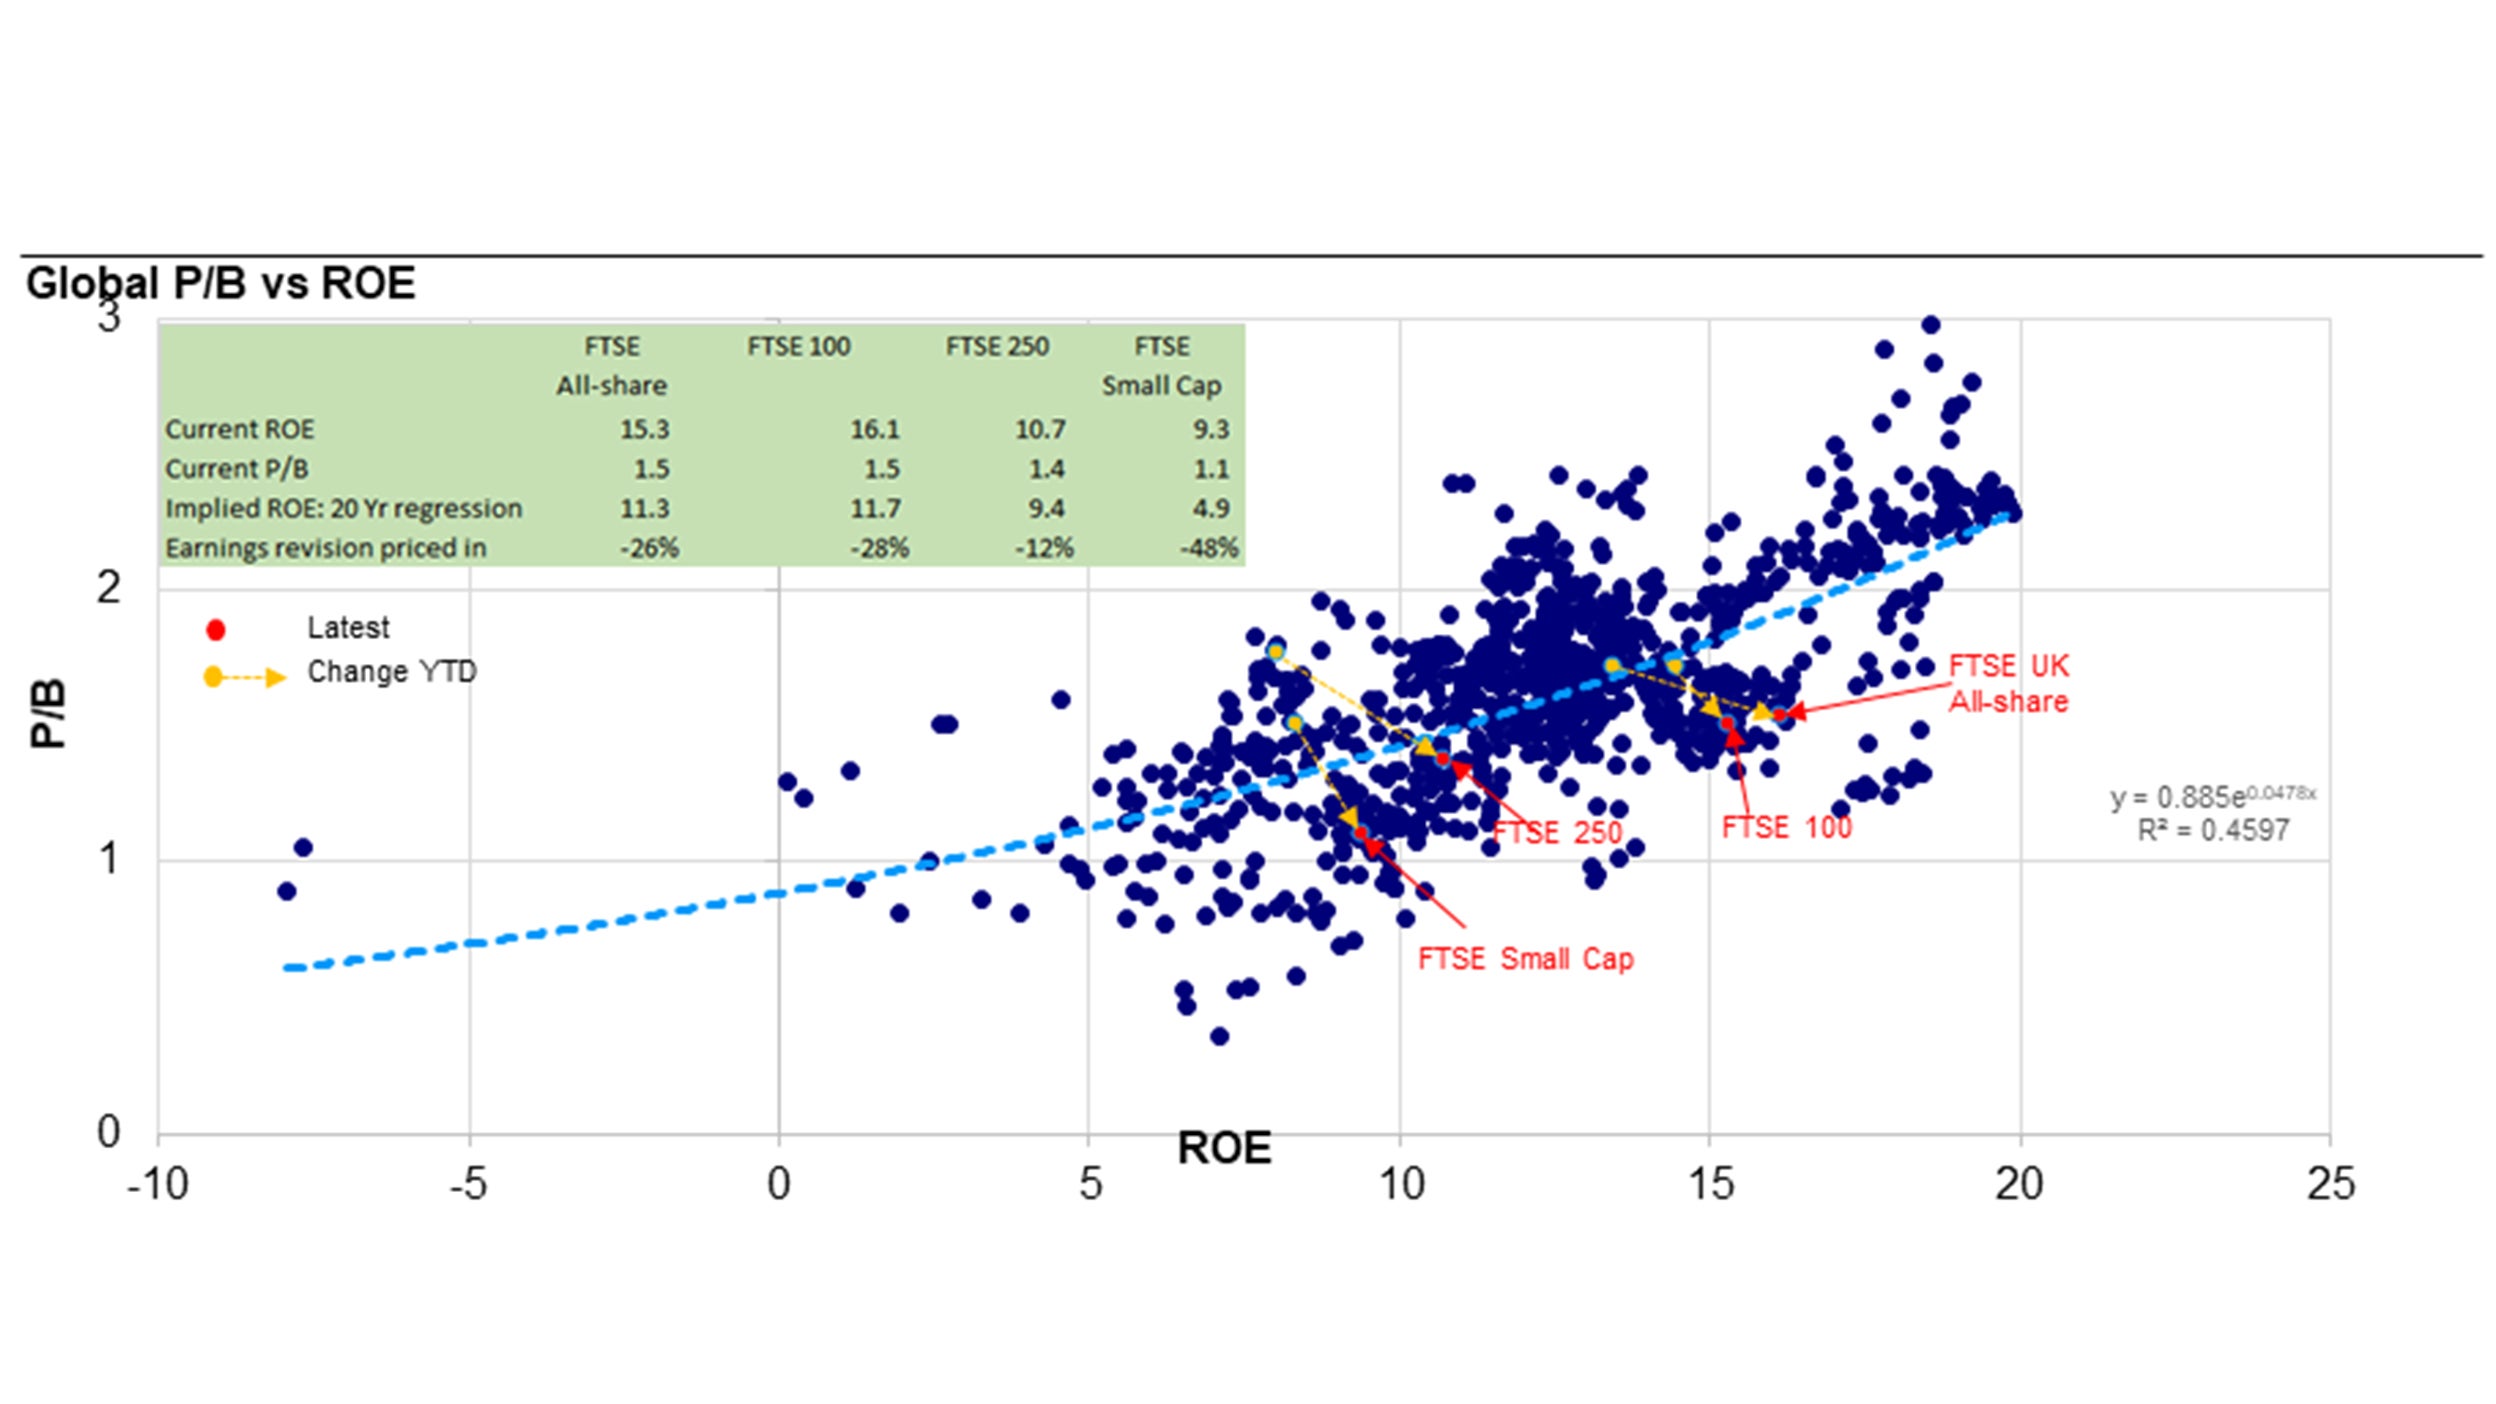
The chart below is identical to the one above, other than that the table summarises the implied cuts to earnings priced in at the end of July.
In short: UK equities look attractive. UK small caps look particularly attractive.
Figure 2. All indices are pricing in cuts to earnings, despite enjoying positive momentum YTD

Source: Invesco, Factset as at 31 July 2022. Indices used: FTSE UK All-share, FTSE UK 100, FTSE 250, FTSE Small Cap. Plots show monthly Price to Book (P/B) ratio against monthly mean rolling 12month estimated Return on Equity (ROE), beginning 31 July. The Implied ROE is the value derived from application of the algebraic equation of the trend line, substituting Current P/B for “y”, and then solving for “x".
History suggests that markets tend to anticipate a recovery at the start of a recession (once a recession has been confirmed), before any recovery has actually come through. The third chart in this series therefore looks at the 30-year history of trailing PE for UK small caps, and subsequent returns over the following 12 months.
Figure 3: 30-year analysis of trailing PE and subsequent returns… historically, buying FTSE Small Caps and <10x trailing earnings has been attractive
.png)
Source: Factset 31 July 2022. All data for FTSE Small Cap ex Investment Trusts. TR = Total Return over the following 12 months. PE = PE ratio excluding negative values, for last 12 months.
It is evident from the analysis that, historically, buying the FTSE Small Caps at times when the trailing PE is <10x has delivered an attractive absolute total return.
Over the past 30 years, there have been 38 months where the trailing P/E has been less than 10x. That’s 10.8% of the time. Only in four of those months was the total return over the following 12 months actually negative. Of course, the pattern of history is not infallible. There are some exceptions, most notably around the start of the Global Financial Crisis in early 2008. However, the average return over the following 12 months whenever the trailing P/E has been <10x was 35.9%.
We accept that UK small caps are more exposed to the UK economy than large caps, which are more internationally exposed. We are also sensitive to the economic headwinds facing many businesses. But the impact of fuel and commodity prices and the pressures created by stretched supply chains are not unique to the UK economy. Inflationary pressures are evident globally. Germany and Italy’s reliance on Russian gas makes their economies (and indeed the EU block) at least as vulnerable as the UK. The corollary of this is that, with their domestic bias, UK small caps should not be disproportionately challenged by macroeconomic factors.
All things considered, the valuation opportunity in UK equities looks attractive right across the market cap spectrum. But the current trailing P/E ratio of the FTSE Small Caps of 8.6x1 looks especially attractive and merits consideration now, rather than simply waiting until Adam Smith’s ‘invisible hand’ restores calm.
Sources
1Factset as of 31 July 2022.
Investment risks
The value of investments and any income will fluctuate (this may partly be the result of exchange rate fluctuations) and investors may not get back the full amount invested.
Important information
This is marketing material and not intended as a recommendation to buy or sell any particular asset class, security or strategy. Regulatory requirements that require impartiality of investment/investment strategy recommendations are therefore not applicable nor are any prohibitions to trade before publication. Where individuals or the business have expressed opinions, they are based on current market conditions, they may differ from those of other investment professionals, they are subject to change without notice and are not to be construed as investment advice.