

17 Jan 2023
The Global Technology Leaders Team discuss valuations, growth expectations for 2023 and how technology can address some of the world’s major challenges.
Entering 2022, we were sceptical of technology companies with strong thematic appeal, high growth expectations but limited profitability. While that proved prescient, even some of the most profitable and resilient tech business models suffered losses as investors adjusted to higher inflation and interest rates. Growth slowed across the sector, given difficult comparisons from the rapid acceleration in digital transformation during COVID lockdowns, economic headwinds, policy pressure in China and supply chain shortages. There were precious few hiding places in the tech sector in 2022.
Given the US Federal Reserve’s key objective is to tame inflation, we expect that economic conditions will have to deteriorate markedly before we reach a peak in the rate hiking cycle. Slowing growth and inflation management could drive ongoing market price fluctuations (volatility) until expectations of growth rationalise further. The equity market is a discounting mechanism, and as in the past, is likely to rebound when expectations for economic growth improve. The technology sector was the first to recover in 2009 following the Global Financial Crisis (GFC), driven by the strength of the sector’s balance sheets, the lack of legacy pension fund liabilities and the fact that earnings growth, while impaired by a weak economy, was still comparatively higher than the broader market – technology continued to take share from the rest of the economy. It is notable that in the 23 equity market bull cycles prior to 2022, technology outperformed other sectors 87% of the time (figure 1).
Sector outperformance rates in prior bull cycles
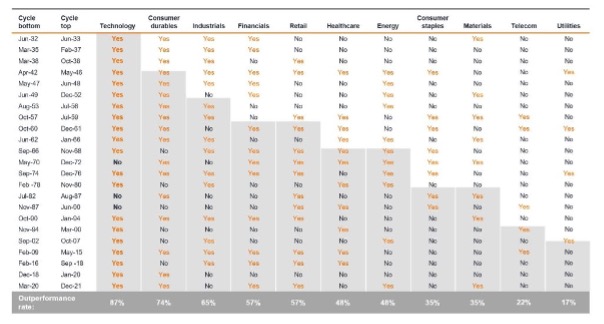
Source: Oppenheimer & Co., Bloomberg, June 1932 to December 2021. Past performance does not predict future returns.
The tech sector saw volatile returns of more than +25% in 2021 and less than -25% year-to-date* in 2022. Part of this volatility was driven by ‘free money’ through unprecedented government intervention, including monetary stimulus and then its withdrawal, which had a multiplier effect on returns. With monetary policy normalisation, we expect 2023 returns could also normalise. At the time of writing (early December 2022), tech valuations are in line with the long-term average but still at the high end of a ten-year range (figure 2).
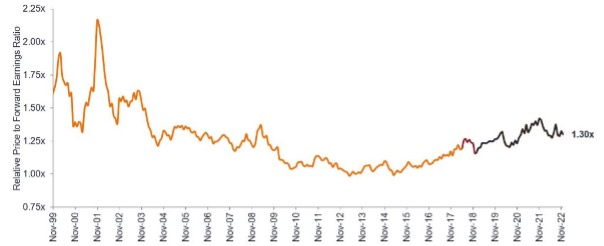
Source: Janus Henderson Investors, Bernstein, as at 8 December 2022.
Note: Forward price-to-earnings ratio is calculated by dividing the current share price by projected earnings for the next 12 months to value a company’s shares. (Orange line) MSCI ACWI Information Technology Index (technology), price-to-forward earnings relative to MSCI ACWI Index (global equities) from September 1999 to November 2018 pre GICS sector changes in MSCI Global indices, then (grey line) MSCI ACWI Information Technology + ACWI Communication Services Index relative to MSCI ACWI Index to 30 September 2022 post GICS sector changes in MSCI Global indices.
We view valuation as a neutral to negative factor for the tech sector when it comes to stock selection. As such our focus is on a company’s earnings power rather than the multiple. We have already seen a sharp correction in earnings expectations for the sector (referring to the orange line in figure 3); a trend that would have been more apparent if not for the resilience of two of the sector’s largest companies, Apple and Microsoft.
While the orange line depicting the breadth of earnings revisions has not yet reached the lowest point we saw after the tech bubble in 2002, GFC in 2009 or pandemic low in 2020, we may be closer to the bottom/end of the downward revisions of company earnings cycle than the top. That said, we do expect further downgrades in the first quarter of 2023, particularly in some areas of the software sector where extraordinary growth rates are still being extrapolated. This point of inflection in valuation has historically, typically been the most attractive time for active managers to invest, and we believe that as we approach it, active stock selection and valuation discipline are going to be key. Many of the tech leaders in the dot.com era took around 20 years to recover to their valuation highs. We do not see a return to ‘free money’, or thematic ‘growth at any price’, and believe that stocks and investment processes that benefited from that environment or theme may not perform as well as they have done previously.
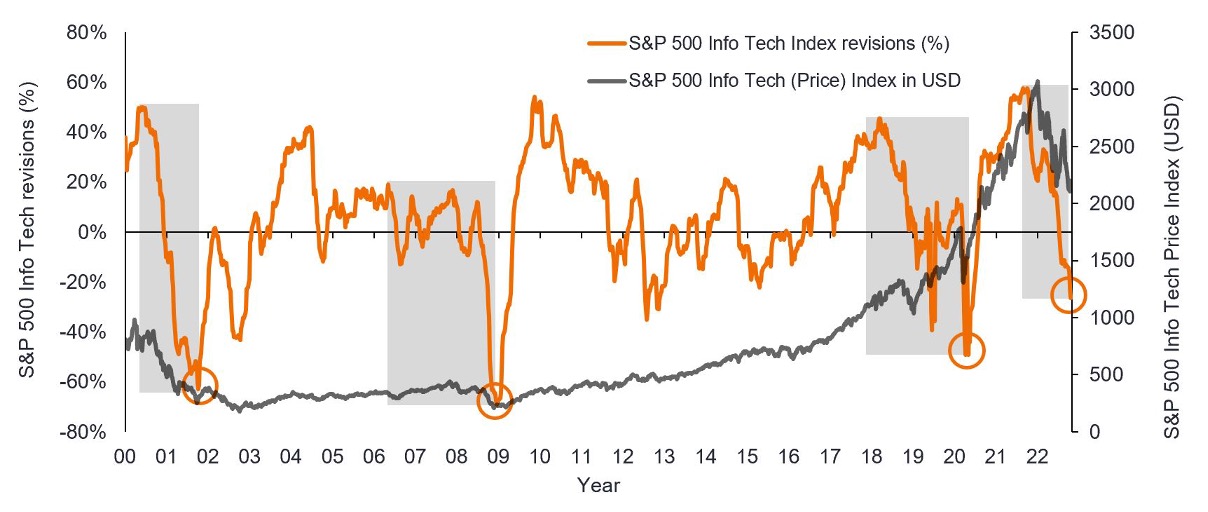
Source: Morgan Stanley, Bloomberg, as at 14 November 2022. Orange line refers to percentage of number of companies within S&P500 Information Technology Index with positive/negative earnings revisions. Past performance does not predict future returns.
We view technology as the science of solving problems. Over the last 50 years rising technology adoption has been a deflationary force but despite the rapid digital transformation during the pandemic, productivity gains have not been evident. This is largely due to weak productivity measurements that fail to capture time and energy savings as they are not accounted for in additional spending or sales.
Inflation is a symptom of challenges such as skills and labour force shortages, high energy costs and threatened energy and data security – all issues that technology can help address.
This need has been recognised by a myriad of regulation and legislation passed in 2022 such as the CHIPS and Science Act and the Inflation Reduction Act in the US. Funding and incentives through such legislation can catalyse further targeted spending and investment in a greener electrical revolution that requires exponentially more semiconductors, components, connectivity, and software.
Technologies that offer efficiency gains such as asset tracking, automation, artificial intelligence, and lower power consumption, are well positioned to take increasing share of tech spending budgets in 2023. Conversely, growth in digital advertising spending looks more challenging given increasing competition and more complex operating environments. While we are wary of companies that seek to grow earnings purely through cost cutting, we do believe that such programmes could drive materially higher profitability as we exit 2022 and could create opportunities in mispriced value.
In our view, tech sector outperformance in 2023 will be less broad-based and less straightforward than in recent years. Rather than following a value or growth style bias or merely identifying investment themes, we think returns are more likely to be delivered by stock picking. Here, deep experience of understanding growth expectations and being disciplined on valuation could be even more important in determining tech stock returns.
Technology is the science of solving problems, with digital transformation remaining in the early stages, with multiple challenges to address. We remain focused on aiming to identify the global technology leaders of the future by focusing on high-quality technology companies that are taking share within growing addressable markets. And similar to our investment approach, these companies typically exhibit strong discipline, investing only where there is the potential for incrementally higher returns on invested capital.
*Source: Refinitiv Datastream. MSCI ACWI Information Technology Index, price returns in US dollars for calendar year 2021 and year-to-date to 8 December 2022. Past performance does not predict future returns.
Important Information:
The views presented are as of the date published. They are for information purposes only and should not be used or construed as investment, legal or tax advice or as an offer to sell, a solicitation of an offer to buy, or a recommendation to buy, sell or hold any security, investment strategy or market sector. Nothing in this material shall be deemed to be a direct or indirect provision of investment management services specific to any client requirements. Opinions and examples are meant as an illustration of broader themes, are not an indication of trading intent, are subject to change and may not reflect the views of others in the organization. It is not intended to indicate or imply that any illustration/example mentioned is now or was ever held in any portfolio. No forecasts can be guaranteed and there is no guarantee that the information supplied is complete or timely, nor are there any warranties with regard to the results obtained from its use. Janus Henderson Investors is the source of data unless otherwise indicated, and has reasonable belief to rely on information and data sourced from third parties. Past performance does not predict future returns. Investing involves risk, including the possible loss of principal and fluctuation of value.
Not all products or services are available in all jurisdictions. This material or information contained in it may be restricted by law, may not be reproduced or referred to without express written permission or used in any jurisdiction or circumstance in which its use would be unlawful. Janus Henderson is not responsible for any unlawful distribution of this material to any third parties, in whole or in part. The contents of this material have not been approved or endorsed by any regulatory agency.
Janus Henderson Investors is the name under which investment products and services are provided by the entities identified in Europe by Janus Henderson Investors International Limited (reg no. 3594615), Janus Henderson Investors UK Limited (reg. no. 906355), Janus Henderson Fund Management UK Limited (reg. no. 2678531), Henderson Equity Partners Limited (reg. no.2606646), (each registered in England and Wales at 201 Bishopsgate, London EC2M 3AE and regulated by the Financial Conduct Authority) and Janus Henderson Investors Europe S.A. (reg no. B22848 at 2 Rue de Bitbourg, L-1273, Luxembourg and regulated by the Commission de Surveillance du Secteur Financier).
Outside of the U.S.: For use only by institutional, professional, qualified and sophisticated investors, qualified distributors, wholesale investors and wholesale clients as defined by the applicable jurisdiction. Not for public viewing or distribution. Marketing Communication.
Janus Henderson, Knowledge Shared and Knowledge Labs are trademarks of Janus Henderson Group plc or one of its subsidiaries. © Janus Henderson Group plc.