05 May 2022
Central bank policy is a focus for markets this year as the narrative has shifted towards tightening. Our fixed income teams consider the conundrums facing investors and where, outside of policy, there are opportunities and risks in the bond markets.
John Pattullo, Co-Head of Strategic Fixed Income
Central banks’ current interest rate policy dilemma is akin to landing a jumbo jet on an aircraft carrier. History suggests soft landings are hard to engineer and even more difficult, in our view, given the deteriorating backdrop. It is not easy coming from behind the curve, compounded by the knee-jerk, stop-start nature of the economy due to COVID shutdowns and subsequent extraordinary fiscal and monetary stimulus. The chance of an economic hard landing is materially higher given the Russia/Ukraine conflict, especially for Europe which is a large energy importer with a weakening currency. It may give cause for the European Central Bank to backtrack on the path of rate rises, but the US has committed to stay the course, for now at least. We remain sceptical about how many rate hikes the US Federal Reserve (Fed) will achieve before altering course, again!
Overall, we believe there will be a shift to the downside for growth this year as high energy prices literally destroy demand. Central banks are tightening as economic data is deteriorating. Inventory builds that helped support the pandemic recovery could now be a further drag on growth, given that significant goods demand was dragged forward via fiscal stimulus during lockdowns. We will also come up against the high base effects in economic data given the prior surge in growth and inflation last year.
We therefore see potential for a policy error from central banks hiking at the peak of an economic cycle. reacting to the actual ‘level’ of growth and inflation. The bond market, in contrast, has more foresight in that it shifts to the rate of change in the data – whether it is accelerating or decelerating. This is the real driver of government bond yields which will price in lower inflation and growth. This creates an opportunity for good cyclical duration – or interest rate sensitivity – management. Our long-communicated conviction of the value of increasing duration in 2022 remains. However, the outlook for credit is less clear given the heightened geopolitical uncertainty manifesting itself via an energy ‘tax’.
The simultaneous move higher in interest rate expectations and the widening of credit spreads has created a complicated task for central banks. From a regional perspective, there is some limit in the degree to which monetary policy can diverge without weakening the exchange rates of the laggards and compounding domestic inflation through the channel of higher import costs. We will likely see a tightening from all major central banks (excluding China), but this misses the bigger picture that certain regions and countries will be required to tighten policy faster than others given their initial economic conditions as they recover from the pandemic and their relative sensitivity to the commodity shock now in train.
2022 GDP impact of oil and gas shock (%)
|
|
US |
China |
Euro Area |
|
Oil* |
-0.3 |
-0.3 |
-0.6 |
|
Gas** |
0 |
0 |
-0.6 |
|
Total |
-0.3 |
-0.3 |
-1.2 |
*Assuming sustained US$ 20/barrel shock.
Source: Goldman Sachs Global Investment Research (GIR), as at 6 March 2022. Past performance does not predict future returns. **The figures above assume best-case scenario (existing disruptions scenario), but GIR’s base case assumes flow disruptions to Russia’s gas exports through Ukraine.
In particular, many European countries will suffer from the combined forces of risk aversion, a rising energy import bill, and a real income squeeze. European growth will be hit much harder by the conflict between Russia and Ukraine not only due to its regional proximity to the conflict, but also due to its energy dependence on Russia. On the other hand, the US economy looks relatively more insulated as a producer of both oil and gas domestically, and recent communications from US Fed chair Powell signal that he doesn’t see a major impact from the conflict on the hiking cycle.
Navigating this environment requires a careful balance between generating income from the higher credit spreads on offer, as well as using government bond duration as a counterbalance. While we are in a rising rate environment, it is important to consider how much has been priced into government yield curves (which indicate market expectations for rates) – short-term rates significantly up, but terminal rates very low. We believe that the path of rates indicated by market pricing is highly unlikely to be delivered and this rate hiking cycle is likely to be shorter than many anticipate as well as sharper than we have experienced in recent periods.
Greg Wilensky, Head of US Fixed Income
While the US is less dependent on commodities than other economies, a sharp jump in commodity prices will still have material effect. According to our calculations, the 35% increase in oil prices in the first quarter will contribute a further 1.4% to CPI by itself1. Even as high base effects and the unwinding of COVID-driven supply bottlenecks will bring inflation down, the impact of the Ukraine invasion will push in the other direction. Europe could fare worse than the US, as oil prices are generally set by global factors while natural gas prices are more regional.
While the short-term impact is clear, assessing the longer-term one is trickier. Inflation could continue to drift higher, as higher commodity prices generate knock-on inflation in other goods which filters through to some upward wage pressure that pushes up service costs. Conversely, higher commodity prices will act as a ‘tax’ on consumers and reduce real economic growth and real income, pushing down demand and, possibly, inflation. This makes the challenge for central banks of orchestrating a soft landing for their economies even more difficult.
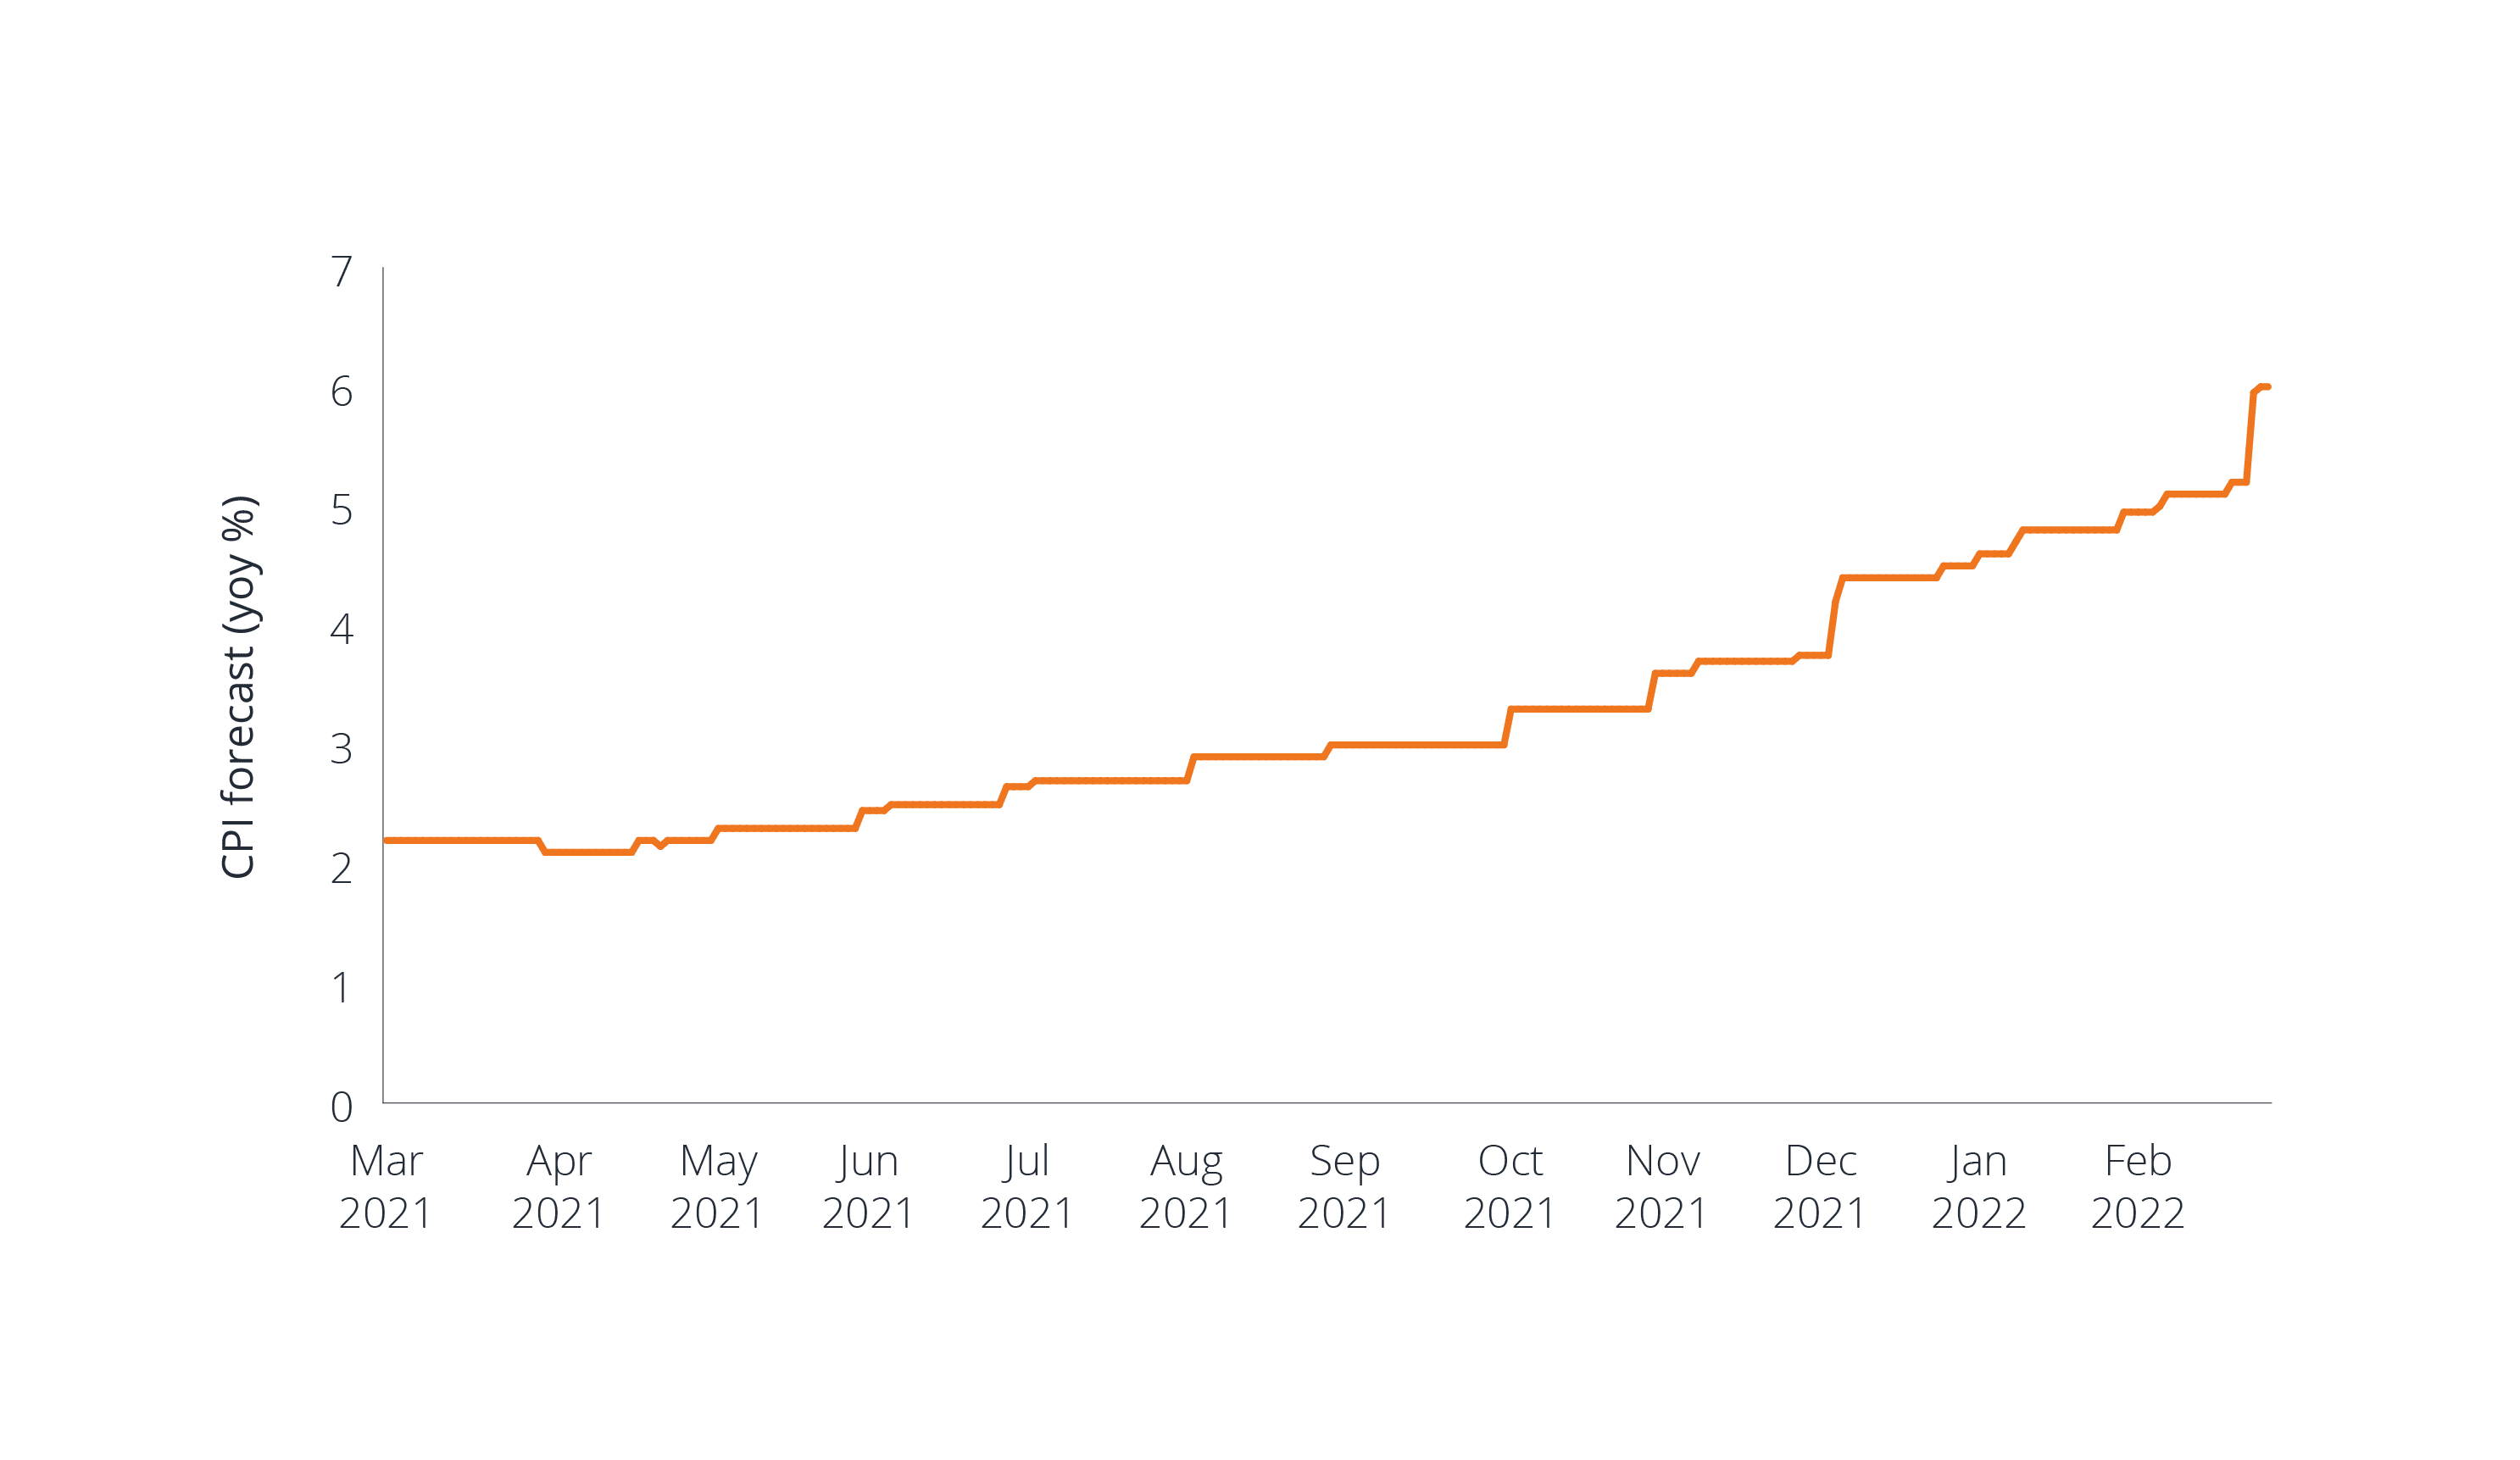
US CPI inflation forecast for 2022 (% yoy)
 Source: Bloomberg, as of 11 March 2022. CPI = Consumer Price Index.
Not surprisingly, as energy prices have spiked, the inflation forecast for 2022 is now much higher than at the start of the year with a significant uptick factored in. For 2023, the TIPS market is pricing inflation in the mid 3% area[1]. This looks high to us as we believe downward pressure from this new ‘tax’ will be playing out even if commodity prices stay at their elevated levels. Given this view, guarding against inflation through TIPS is no longer attractive unless you expect oil prices to continue to march higher.
John Kerschner, Head of US Securitized Products
Rotating portfolio exposure toward investments that can be resilient during a rate hike cycle seems prudent. Namely, sectors and securities that are less sensitive to interest rate moves and of a fundamental strength that can hold up during economic weakness. For example, the bank loan market could be a fertile hunting ground for investors comfortable with high yielding sub-investment grade risk. Another option that investors could consider is securitised assets which pay floating rate coupons that rise in tandem with a benchmark interest rate. Securitised assets also often have the added benefit of an amortising structure where the principal is periodically paid over time, resulting in a shorter weighted average life and less sensitivity to interest rates.
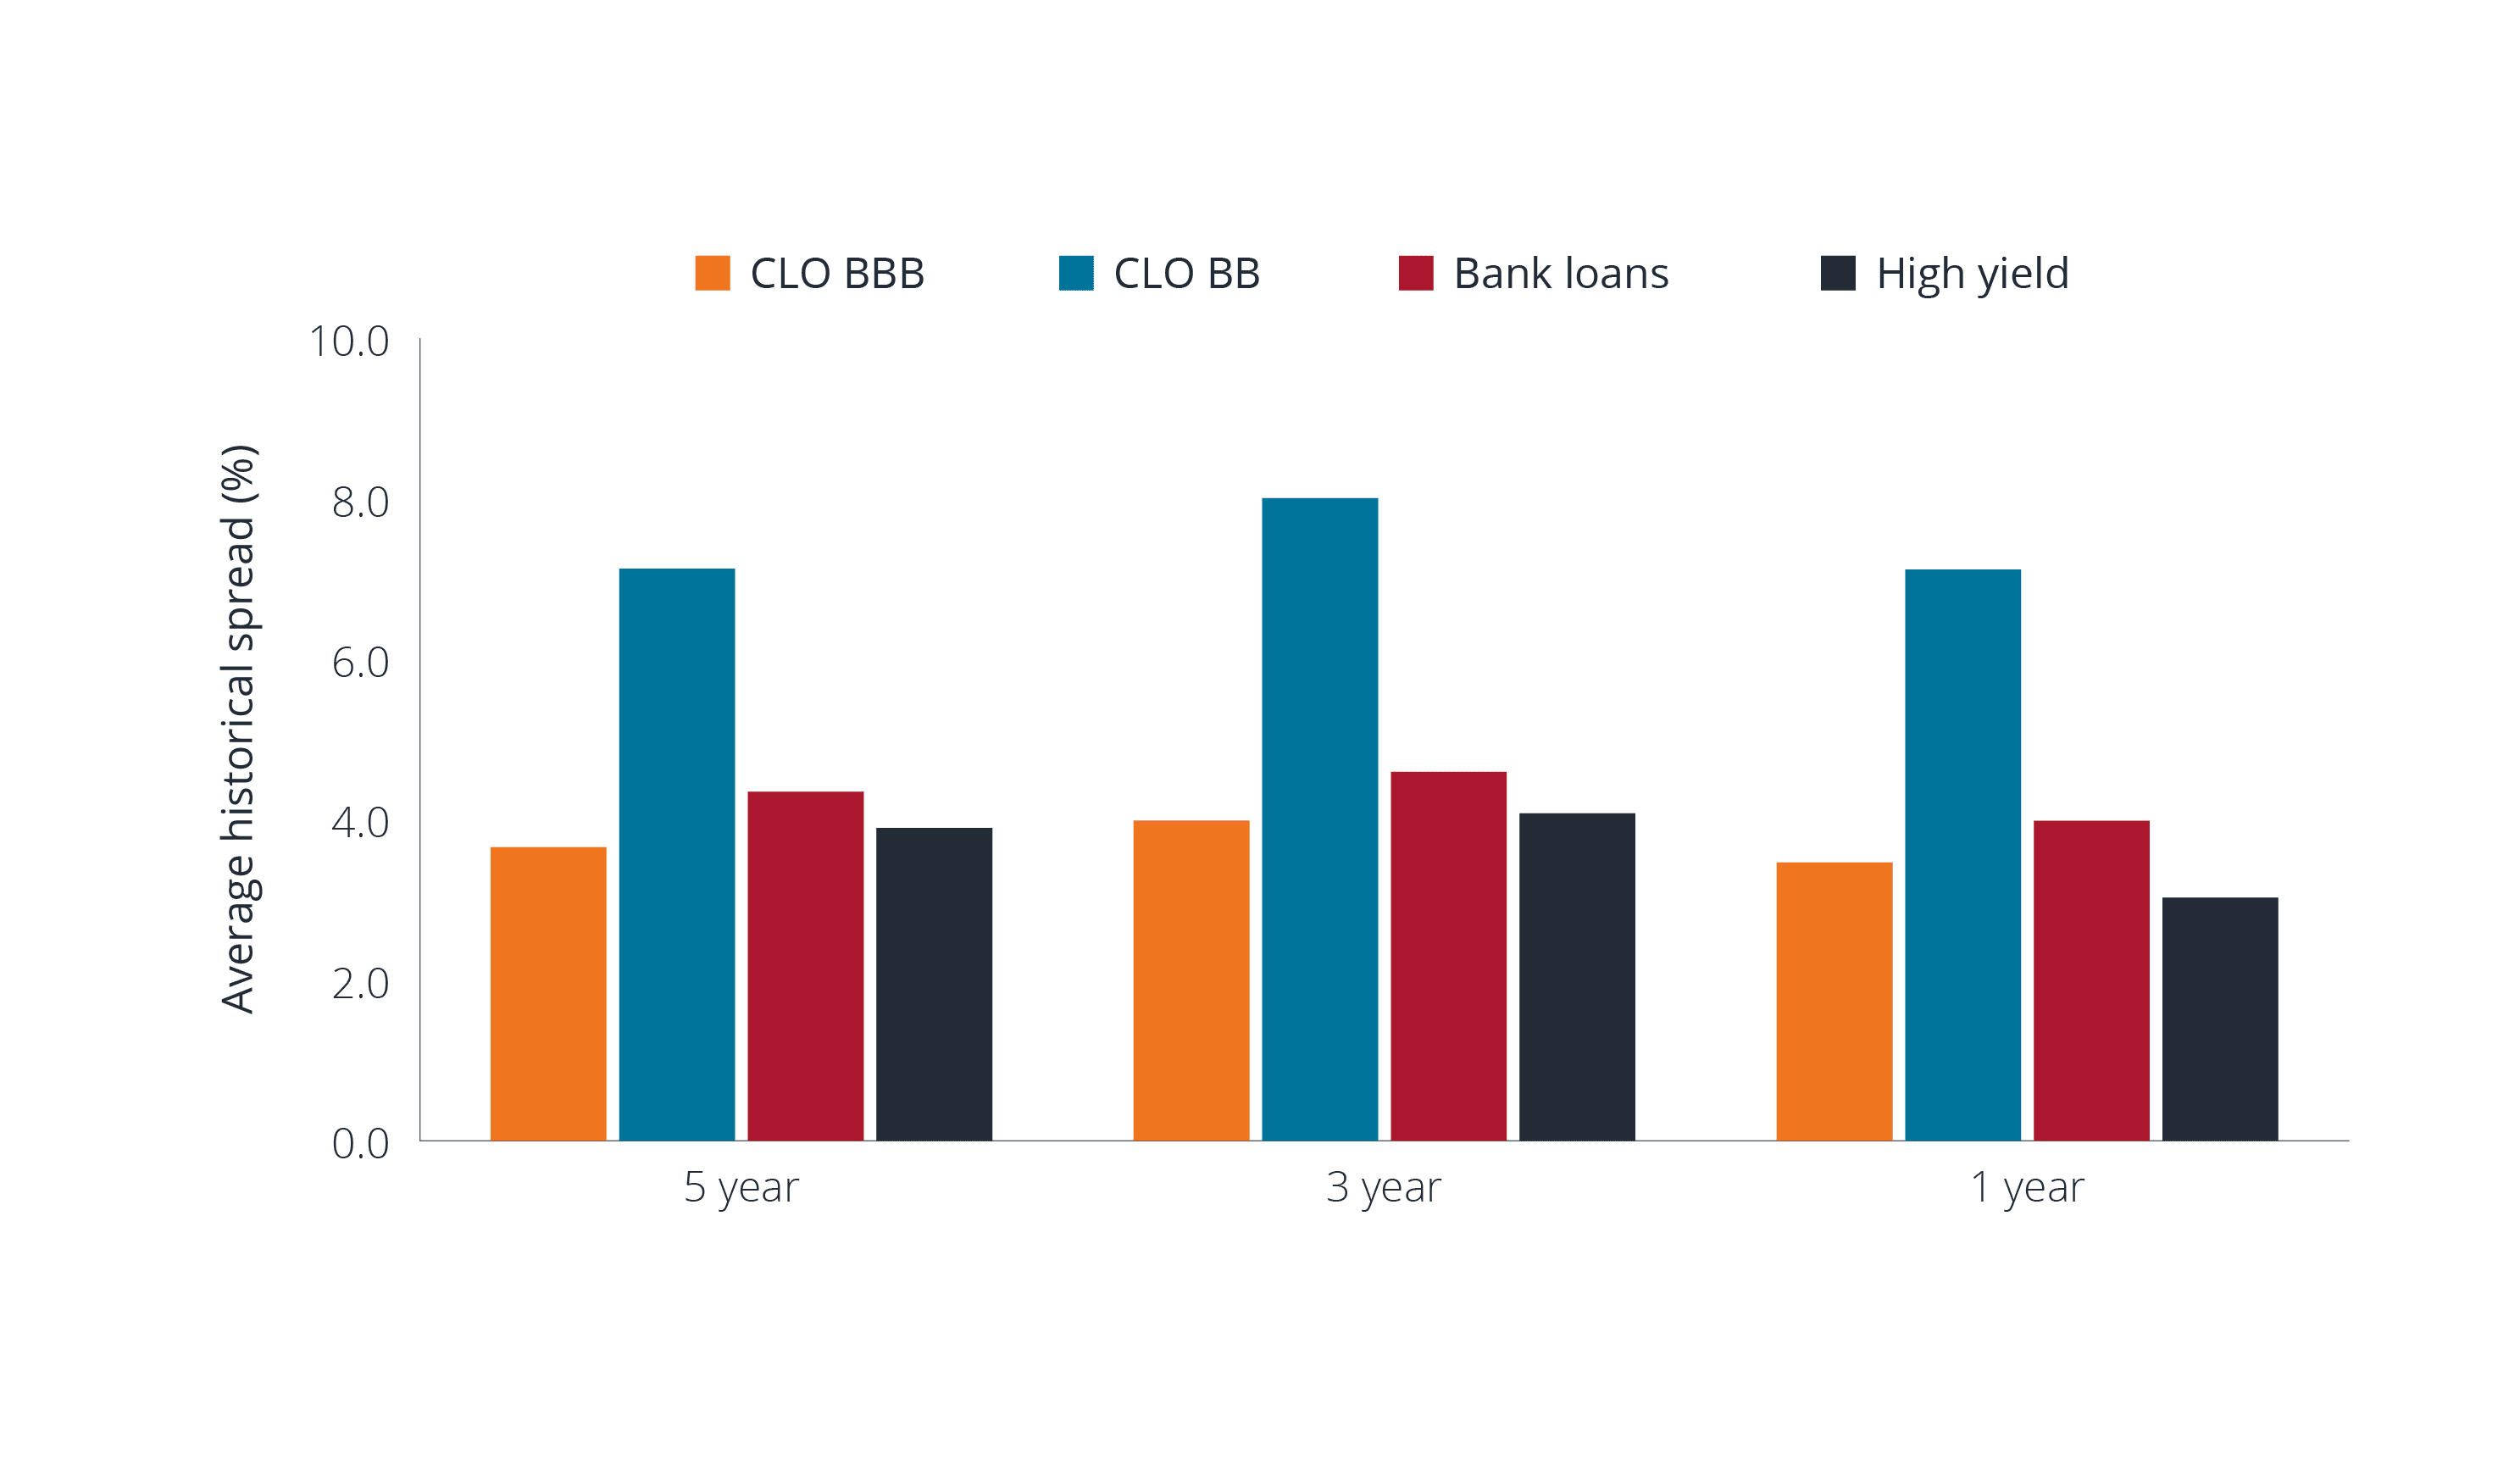
The expansive universe of securitised investments allows investors to not only diversify risk factors within portfolios, but also dial risk up and down by investing in different parts of the capital structure. With collaterised loan obligations (CLOs) – where loans are pooled or securitised to create different tranches of credit quality – investors can access floating-rate exposure across the investment-grade rating spectrum. Despite being rated higher quality, BBB rated CLOs have historically offered yields closer to the bank loan and high yield corporate bond markets.
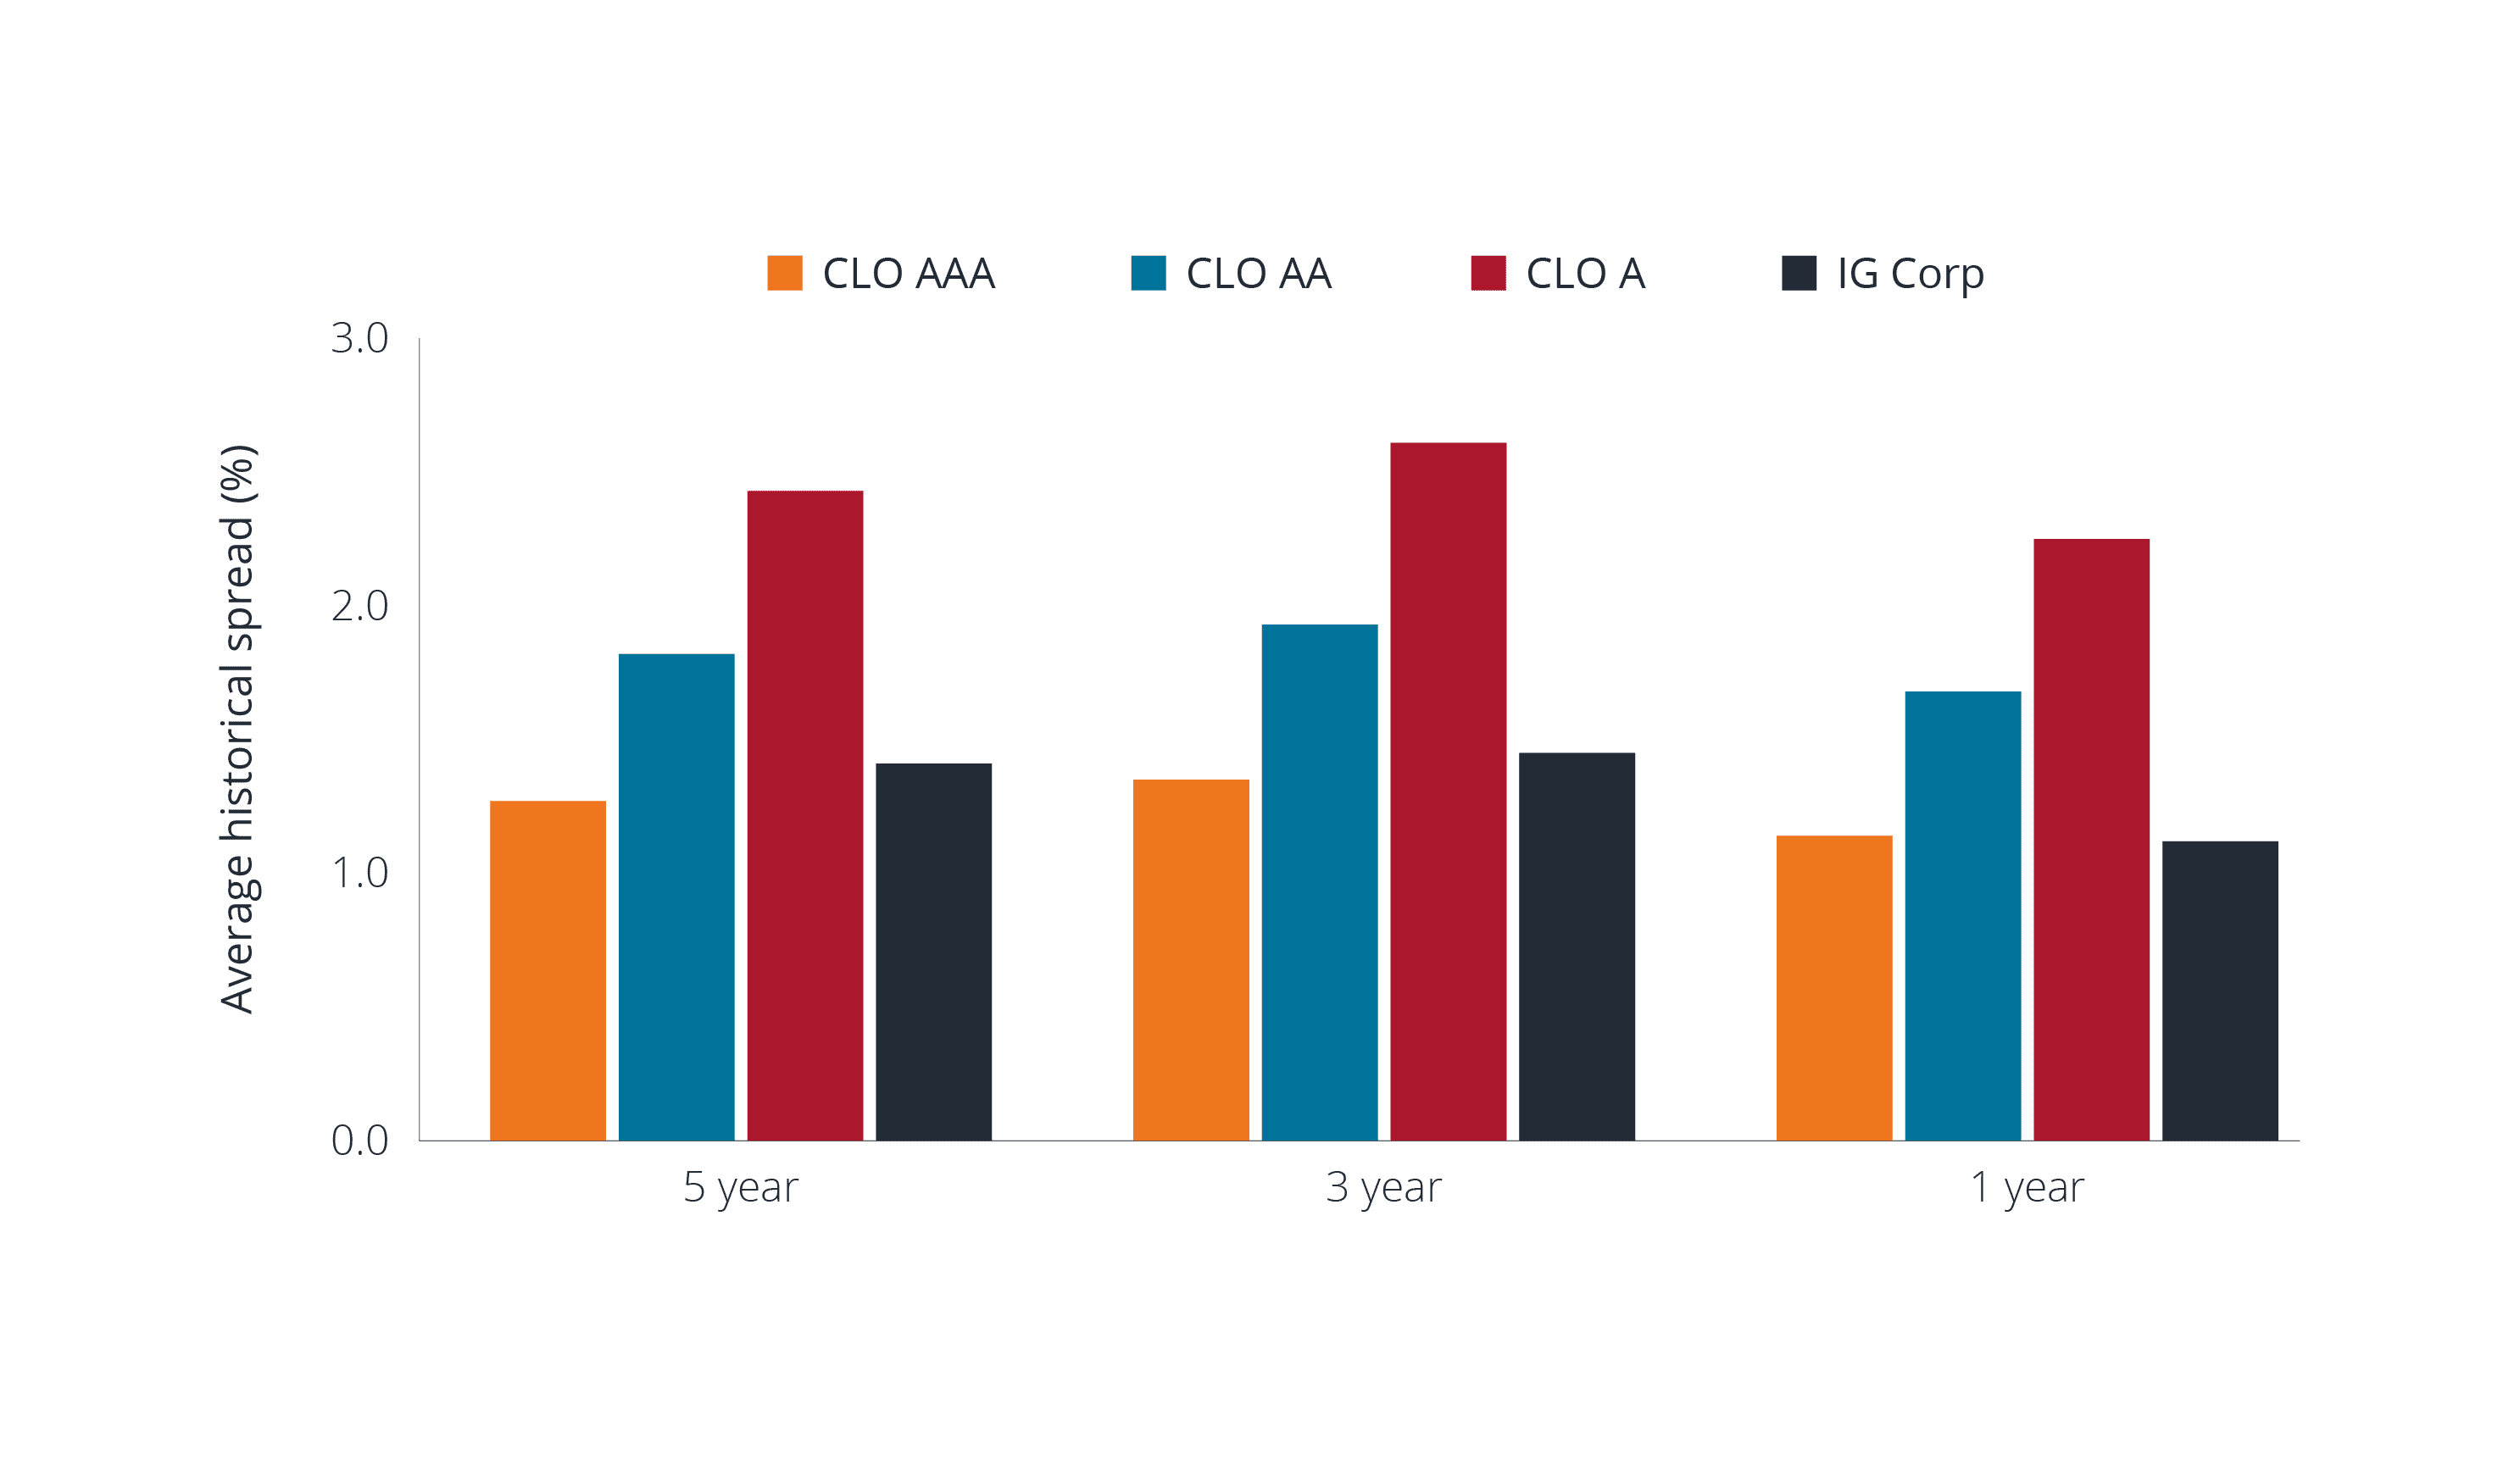
The Spread Advantage: CLO vs. Corporate Spreads


Source: Janus Henderson, JP Morgan, Bloomberg, as of 31 December 2021. CLO spreads are calculated using discount margin (DM) and compared to option-adjusted spread for corporates and high yield. Corporate and high yield are spread off treasuries while bank loans are off LIBOR. JPMorgan JULI Indices used for corporate credit, and CLOIE for CLO.
The relative attractiveness of investment-grade CLO yields is maintained as you move up the rating spectrum. CLOs with AAA ratings offer spreads comparable to corporate bonds, and AA and A rated CLOs offer a premium over investment-grade corporates. It is also worth noting that the previous lows in CLO spreads (higher prices) were achieved during a Fed hiking period. CLOs also performed better during the last Fed hiking cycle than other similarly rated US government and US aggregate indices.
Elevated activity in LBOs and M&A
James Briggs, Portfolio Manager
2021 was a record year for activity in the leveraged finance market, mainly led by private equity driven mergers and acquisitions (M&A) and leveraged buyouts (LBOs)[2]. There is the view that 2022 could see similar or higher levels of activity as large amounts of cash enable private equity investors to pursue bigger deals and enhanced returns, while companies look for complementary businesses to secure growth. ESG will likely drive some deal activity too as CEOs look to move companies to more sustainable business models.
However, 2022 may see less M&A activity than 2021 due to macroeconomic concerns, higher inflation and rate rises making the level companies can borrow at to fund acquisitions less attractive. One concern is that more LBO supply will contribute to wider spreads that are already facing headwinds from central banks tightening policy. We expect the loan market – which has seen strong investor demand – to absorb a lot of that supply. As corporate cash balances have fallen to average levels[3] and earnings growth slows, acquisition financing through debt reflects a renewed focus from companies on shareholder returns and solidifying market positions as they face intense competition and rising costs.
This is where bond investors could benefit in participating in big transformational acquisitions, but when purchasing debt related to M&A, investors need to pay attention to fundamentals, valuations and any sector specific themes or market dynamics. Identifying which camp M&A falls into is key for investors. M&A pursued by market leaders with superior technologies, brands and or operating models – which see the benefit of increasing scale to improve their route to market or geographic reach – often have the management expertise to integrate acquisitions successfully. In the other camp, M&A is undertaken by companies experiencing competitive threats, and without clear mitigation strategies; instead they often use debt-fuelled acquisitions in an attempt to offset (or cover up) disappointing organic growth.
Geopolitical tensions and their influence on EM risk premia
Hervé Biancotto, Portfolio Manager
Geopolitical tensions are sadly nothing new for emerging market (EM) countries. Previous bouts of such events tend to get compartmentalised by investors even without a speedy resolution. That is because the market is not homogenous – indeed, there are 59 countries in the JPM Corporate Emerging Market Bond Index (CEMBI) and 69 in the JPM Emerging Market Bond Index (EMBI). With such a wide array of opportunities, there have always been winners to compensate for the losers.
Contagion from the Russia/Ukraine conflict is likely to be minimised for technical reasons. Russia’s weighting in the CEMBI and EMBI was already small prior to the tensions at ~3-4%[4] and has been excluded altogether since the end of March. This has resulted in the re-weighting of other countries within indices slightly higher, while also removing some price volatility stemming from Russian bonds. Russia’s prominence in international financial markets waned after sanctions were introduced in 2014 following the annexation of Crimea. Consequently, it was a small part of indices and investors’ portfolios. All of this suggests that the conflict should have limited broader contagion to the rest of EM over time.
EM credit started off the year on a weak footing, and unsurprisingly had a knee-jerk reaction to recent tensions. CEMBI and EMBI spreads have seen significant widening since the start of the year[5], reflecting the paradox of expected tighter monetary conditions coupled with forecasts of persistently high inflation owing to a supply shock due to the conflict. While there is risk premia at current spread levels, it is not as high as it was during the height of the pandemic in 2020, most likely reflecting the lack of broad-based contagion fears. As investors have adjusted to the reality that the current tensions may take longer than expected to resolve, EMBI spreads have already started to retrace from the recent wides, particularly in high yield sovereigns6 as investors look to add back risk. With most of the bad news (sanctions, index exclusion, default, etc) priced in, we believe that sentiment can shift rapidly, rendering the current high risk premia temporary.
Balancing improving fortunes in energy with the sector’s high carbon profile
Portfolio Managers Tom Ross and Brent Olson
Even prior to the latest price spike, the energy sector has benefitted from higher oil and commodity prices in the post-pandemic recovery, and with the recent restrictions on Russia, any energy producers outside of Russia are at an advantage. For many large industries, energy is required for production and rising input costs will be a headwind for profits. Higher energy prices could also impede global economic growth, and inflation is already squeezing consumers’ real incomes. In light of such challenges, there aren’t many sectors where there is significant visibility going forward, except for energy as a beneficiary of higher prices. Nevertheless, risks exist given the herculean task for high-emission sectors to transition their businesses to a low carbon economy. However, some of the European oil majors have come up with a credible transition plan.
When evaluating companies’ future transition potential, we weigh them up on an individual basis using fundamental research. Combining both proprietary analysis and third-party data, such as the Transition Pathway Initiative (TPI) scoring, enables us to focus on ESG trajectories and company action plans to address risks and progress. We believe channelling more capital into clean energy and new technologies is needed as well as helping high-emission and harder-to-abate sectors – that are vital to economic growth – to decarbonise, such as through engagement. This is likely to have a more authentic impact on decarbonising the real economy.
Important Information
The views presented are as of the date published. They are for information purposes only and should not be used or construed as investment, legal or tax advice or as an offer to sell, a solicitation of an offer to buy, or a recommendation to buy, sell or hold any security, investment strategy or market sector. Nothing in this material shall be deemed to be a direct or indirect provision of investment management services specific to any client requirements. Opinions and examples are meant as an illustration of broader themes, are not an indication of trading intent, are subject to change and may not reflect the views of others in the organization. It is not intended to indicate or imply that any illustration/example mentioned is now or was ever held in any portfolio. No forecasts can be guaranteed and there is no guarantee that the information supplied is complete or timely, nor are there any warranties with regard to the results obtained from its use. Janus Henderson Investors is the source of data unless otherwise indicated, and has reasonable belief to rely on information and data sourced from third parties. Past performance does not predict future returns. Investing involves risk, including the possible loss of principal and fluctuation of value.
Not all products or services are available in all jurisdictions. This material or information contained in it may be restricted by law, may not be reproduced or referred to without express written permission or used in any jurisdiction or circumstance in which its use would be unlawful. Janus Henderson is not responsible for any unlawful distribution of this material to any third parties, in whole or in part. The contents of this material have not been approved or endorsed by any regulatory agency.
Janus Henderson Investors is the name under which investment products and services are provided by the entities identified in the following jurisdictions: (a) Europe by Janus Henderson Investors International Limited (reg no. 3594615), Janus Henderson Investors UK Limited (reg. no. 906355), Janus Henderson Fund Management UK Limited (reg. no. 2678531), Henderson Equity Partners Limited (reg. no.2606646), (each registered in England and Wales at 201 Bishopsgate, London EC2M 3AE and regulated by the Financial Conduct Authority) and Henderson Management S.A. (reg no. B22848 at 2 Rue de Bitbourg, L-1273, Luxembourg and regulated by the Commission de Surveillance du Secteur Financier)
Outside of the U.S.: For use only by institutional, professional, qualified and sophisticated investors, qualified distributors, wholesale investors and wholesale clients as defined by the applicable jurisdiction. Not for public viewing or distribution. Marketing Communication.
Janus Henderson, Janus, Henderson, Knowledge Shared and Knowledge Labs are trademarks of Janus Henderson Group plc or one of its subsidiaries. © Janus Henderson Group plc.
[1] Source: Barclays, as of 31 March 2022.
[2] Source: Baker McKenzie, 2022.
[3] Source: BNP Paribas, as at 18 February 2022.
[4] Source: JP Morgan, as at 31 December 2021.
[5] Source: Bloomberg, as at 31 March 2022.