

03 Mar 2022
Adam Hetts and Sabrina Geppert from the Portfolio Construction and Strategy (PCS) Team consider the value of an additional allocation to European equities for UK investors.
Key takeaways:
Our recent portfolio consultations have highlighted an interesting question for consideration: is it time for UK investors to give more consideration to Europe ex-UK equities as a diversifier and optimiser at a broader portfolio level?
The local market phenomenon
UK advisors like to invest in the UK. The UK IFAs we have worked with have a significant proportion of their equities allocation invested in the UK (c. 38%), compared to the UK’s relatively small share of the total global market cap (c. 4%) – see Exhibit 1. But this is far from an unusual scenario; home bias is a global phenomenon. We see this dynamic repeated across different markets, with local equities representing a relatively large proportion of IFA allocations across the US, Italy, Australia and almost everywhere else.
Exhibit 1: Equity portfolio home-market bias
Globally ubiquitous, universally concerning
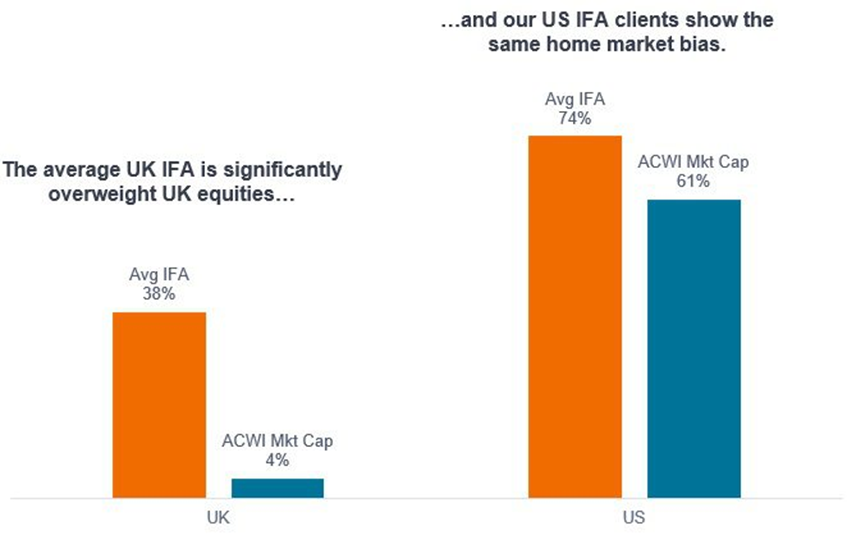
Source: Portfolio Construction & Strategy Group, Morningstar, as at 31 December 2021. Average UK and US advisor public equity allocation based on data shared with the PCS Team by UK and US IFA clients vs. MSCI All Country World Index (ACWI) Gross Return in local currency terms for the UK and US Market Cap.
What is unique about the UK is that not only do we see a concentrated allocation to domestic equities, but the UK market itself is concentrated in a few key sectors. The argument here is not that IFAs should significantly cut their UK equity allocation, but that European equities may represent a useful source of diversification to the UK in terms of a more traditional ‘Europe including UK’ allocation.
Diversification by scale
Europe (represented here by the eurozone) is more than five times the size of the UK economy, third only to the US, in terms of gross domestic product (GDP) – see Exhibit 2. With that comes a much bigger investment opportunity set, as well as a more diverse economic structure and sector orientation.
Exhibit 2: European investment opportunity set
Europe's economy rivals the US and China in size
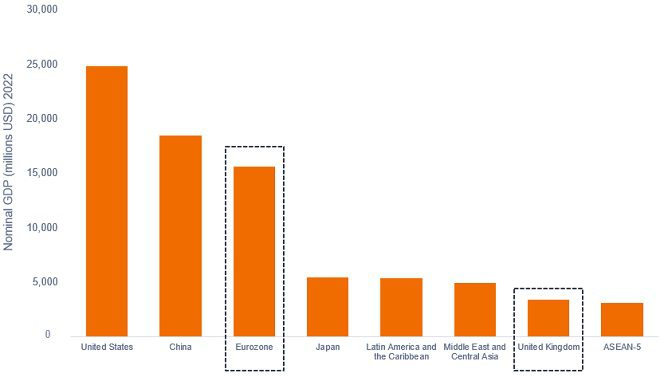
Source: IMF, World Economic Outlook Database, estimates as at October 2021. ASEAN-5 countries are Indonesia, Malaysia, the Philippines, Singapore and Thailand.
Given that both the UK and Europe are still in the early stages of the post-pandemic recovery, a prudent approach for investors to consider could be to diversify their recovery trades into bigger economies that are also still recovering.
There is no substitute for local ownership
The FTSE All-Share Index is arguably the most ‘international’ of all major indices, providing investors access to global companies with geographically diversified revenues. It is a highly liquid market, populated by businesses operating within a well-structured regulatory framework. This ‘international’ status is the foundation of a common argument for UK equities.
But while revenues from these companies might be generated from all over the world, whether looking at the FTSE UK All-Cap Index or the FTSE 100 Index, only 17% of revenues for UK-listed companies comes from Europe ex UK – see Exhibit 3 – creating a meaningful lack of true European exposure compared to owning local companies via a Europe ex-UK index.
Exhibit 3: Local revenues versus international revenues
Even in a globalised world, we believe there is little substitute for local ownership
.png)
Source: Morningstar, as at 31 January 2022. Shows percentage revenue exposures by index FTSE UK All-Share Total Return Index (in local currency terms), FTSE 100 Total Return Index, MSCI Europe ex UK Index Gross Return and S&P 500 Total Return Index (in local currency terms).
Attractive valuations: the UK is not alone
An obvious consideration for investors is the difference in valuations between markets. The US equity market has provided the greatest returns versus European and UK equities, with performance from the S&P 500 Index steadily diverging from the MSCI Europe ex-UK Index and FTSE All-Share Index since 2011. This divergence rapidly increased during the COVID era – Exhibit 4.
Exhibit 4: Post-Global Financial Crisis, post-COVID performance
IFAs are focusing on markets earlier in the recovery cycle
.png)
Source: Portfolio Construction & Strategy Group, Morningstar as at 31 January 2022. S&P 500 Total Return Index, MSCI Europe ex-UK Gross Return Index, FTSE All-Share Total Return Index. Total returns in local currencies from 31 March 2020 to 31 January 2022. Rebased to 100 at start date. Past performance does not predict future returns.
The UK’s crisis of confidence, driven by Brexit uncertainty, briefly abated after the UK officially left the European Union (EU) at the end of January 2020, only to be replaced by pandemic pandemonium, which left many UK companies deeply discounted relative to their global peers. For those investors that considered UK equities a good long-term value opportunity before the pandemic, they are even more likely to favour them now given how significantly they have lagged, even at this early stage in the global recovery.
But the UK is not alone. While Europe may be ahead of the UK in terms of overall returns (in local currency terms) during the period shown in exhibit 4, it remains well behind the US. And while the UK may arguably represent genuine value, any potential discount may not be consistent across all sectors.
A deeper look at sectors reveals more opportunity
While current European equity market valuations are meaningfully higher than the UK, they remain well below the US with 12-month forward price-to-earnings at 19.5x* for the S&P 500, 15.20x* for the MSCI Europe ex-UK Index and 11.2x* for the FTSE All-Share Index. This puts valuations for European equities right in the middle: more expensive than the UK but less expensive than the US.
*Source: Bloomberg, 12-month forward price-to-earnings (P/E) ratios, as at 31 January 2022. Past performance does not predict future returns.
This is where we think it is important to recognise that many of the key cyclical sectors in Europe that can act as good portfolio diversifiers are trading at less expensive valuations than the UK. As Exhibit 5 shows, there are drastic differences in valuations between different sectors in the UK and Europe. As noted earlier, given that the EU is earlier in the recovery cycle than the US, European equities may provide an avenue for investors to broaden their exposure to favoured ‘recovery’ sectors.
Exhibit 5: UK, Europe ex-UK and US equity market valuations
UK shows lowest overall valuations
.png)
Source: Portfolio Construction & Strategy Group, Bloomberg as at 31 January 2022. 12-month P/E is price-to-earnings ratio based on 12-month consensus estimates for S&P 500 Total Return Index, MSCI Europe ex UK Gross Return Index (in local currency terms) and FTSE UK All-Share Total Return (in local currency terms). Past performance does not predict future returns.
UK and Europe: diverging economies
The UK market is characterised by its relatively large exposure to consumer staples, financials and energy. For Europe, similarly large exposure can be found in industrials, healthcare, consumer discretionary and technology. These differences represent a significant divergence in the make-up of these two markets.
Exhibit 6: UK versus Europe ex-UK sector weight differentials
Europe has higher weighing to sectors with the lowest valuations
.png)
Source: Portfolio Construction & Strategy Group, Morningstar as at 31 January 2022. Relative sector weights for the MSCI Europe ex-UK Gross Return Index, in local currency, versus the FTSE UK All Share Total Return Index, in local currency.
The height of the bars in Exhibit 6 show the difference in sector weights between the UK and Europe, with technology, industrials, healthcare, consumer discretionary, and utilities representing Europe’s overweights relative to the UK. Arguably, some of these sectors appear attractive at this stage of the global recovery:
For investors that believe we are in more of a reopening/recovery environment than a lockdown/pandemic environment, then a greater allocation to Europe may potentially allow them to take advantage of its particular sector attributes.
But the valuation conversation is more nuanced than it first appears. The sectors in orange in Exhibit 6 are the ones where the European market has a lower valuation than the UK. Three of them – industrials, consumer discretionary and utilities – fall within the ‘reopening winners’ category. Even though Europe is more expensive than the UK overall, having exposure to these sectors in Europe could complement a UK-biased portfolio.
The devil is in the details…
The views here are given from the perspective of creating a diversified equity portfolio, without consideration for other specific investment objectives. Some may argue that continued Brexit uncertainties are overdone, that the UK represents the lowest overall valuations, and remains at an earlier stage in its recovery from the pandemic.
That said, we struggle with the argument that a 34% overweight on average by UK IFAs to UK equities relative to the UK’s share of the total global market cap is not an extraordinary decision. Europe offers some of the largest and best value exposure to specific sectors. Only 17% of the revenues for UK companies come from European sources, meaning that an allocation to European equities could help to improve diversification for UK-biased portfolios. We are also only partway through a global recovery, where both the UK and Europe have a long way to go. These arguments justify why investors may want to consider reallocating their European equities allocation in their next portfolio rebalancing exercise.
The views presented are as of the date published. They are for information purposes only and should not be used or construed as investment, legal or tax advice or as an offer to sell, a solicitation of an offer to buy, or a recommendation to buy, sell or hold any security, investment strategy or market sector. Nothing in this material shall be deemed to be a direct or indirect provision of investment management services specific to any client requirements. Opinions and examples are meant as an illustration of broader themes, are not an indication of trading intent, are subject to change and may not reflect the views of others in the organization. It is not intended to indicate or imply that any illustration/example mentioned is now or was ever held in any portfolio. No forecasts can be guaranteed and there is no guarantee that the information supplied is complete or timely, nor are there any warranties with regard to the results obtained from its use. Janus Henderson Investors is the source of data unless otherwise indicated, and has reasonable belief to rely on information and data sourced from third parties. Past performance does not predict future returns. Investing involves risk, including the possible loss of principal and fluctuation of value.
Not all products or services are available in all jurisdictions. This material or information contained in it may be restricted by law, may not be reproduced or referred to without express written permission or used in any jurisdiction or circumstance in which its use would be unlawful. Janus Henderson is not responsible for any unlawful distribution of this material to any third parties, in whole or in part. The contents of this material have not been approved or endorsed by any regulatory agency.
Janus Henderson Investors is the name under which investment products and services are provided by the entities identified in the following jurisdictions: (a) Europe by Janus Capital International Limited (reg no. 3594615), Henderson Global Investors Limited (reg. no. 906355), Henderson Investment Funds Limited (reg. no. 2678531), Henderson Equity Partners Limited (reg. no.2606646), (each registered in England and Wales at 201 Bishopsgate, London EC2M 3AE and regulated by the Financial Conduct Authority) and Henderson Management S.A. (reg no. B22848 at 2 Rue de Bitbourg, L-1273, Luxembourg and regulated by the Commission de Surveillance du Secteur Financier).
Janus Henderson, Janus, Henderson, Intech, Knowledge Shared and Knowledge Labs are trademarks of Janus Henderson Group plc or one of its subsidiaries. © Janus Henderson Group plc.